Fxiaoke Developer Manual Fxiaoke Developer Manual
  • APL Development Manual
  • PWC Development Manual
  • OpenAPI Documentation
  • Custom Components (PC)
  • Custom Components (Mini Program)
  • Custom Plugins (PC)
  • Custom Plugins (Mini Program)
  • Third-party Integration Plugins (H5)
  • API (PC)
  • API (Mini Program)
  • Fx DevTools
Update Log
  • 简体中文
  • English
  • Custom Components (PC)
  • Custom Components (Mini Program)
  • Custom Plugins (PC)
  • Custom Plugins (Mini Program)
  • Third-party Integration Plugins (H5)
  • API (PC)
  • API (Mini Program)
  • Fx DevTools
Update Log
  • 简体中文
  • English
  • Getting Started

  • Components

  • Examples

  • FAQ

    • Custom Component's Data Property
    • How to Reuse Custom Components
    • How to Compatible with PC and Mobile
    • How to Debug Custom Components
      • iframe Embedding Issues
    Table of Contents

    How to Debug Custom Components

    # How to Debug Custom Components

    This section explains how to debug custom components to help developers quickly identify and resolve issues.

    # Prerequisites

    Before learning how to debug custom components, you should know:

    1. Custom components are developed based on the JavaScript ecosystem.
    2. Custom components are developed based on the Vue ecosystem.

    # Debugging Tools

    We recommend using the Chrome browser and its built-in DevTools for debugging (other non-WebKit browsers offer similar tools with slightly different usage). For detailed instructions, click here (opens new window).

    # Debugging JavaScript

    To open the console:

    • macOS: Press Cmd + Option + I or right-click and select Inspect.
    • Windows: Press F12 or right-click and select Inspect.
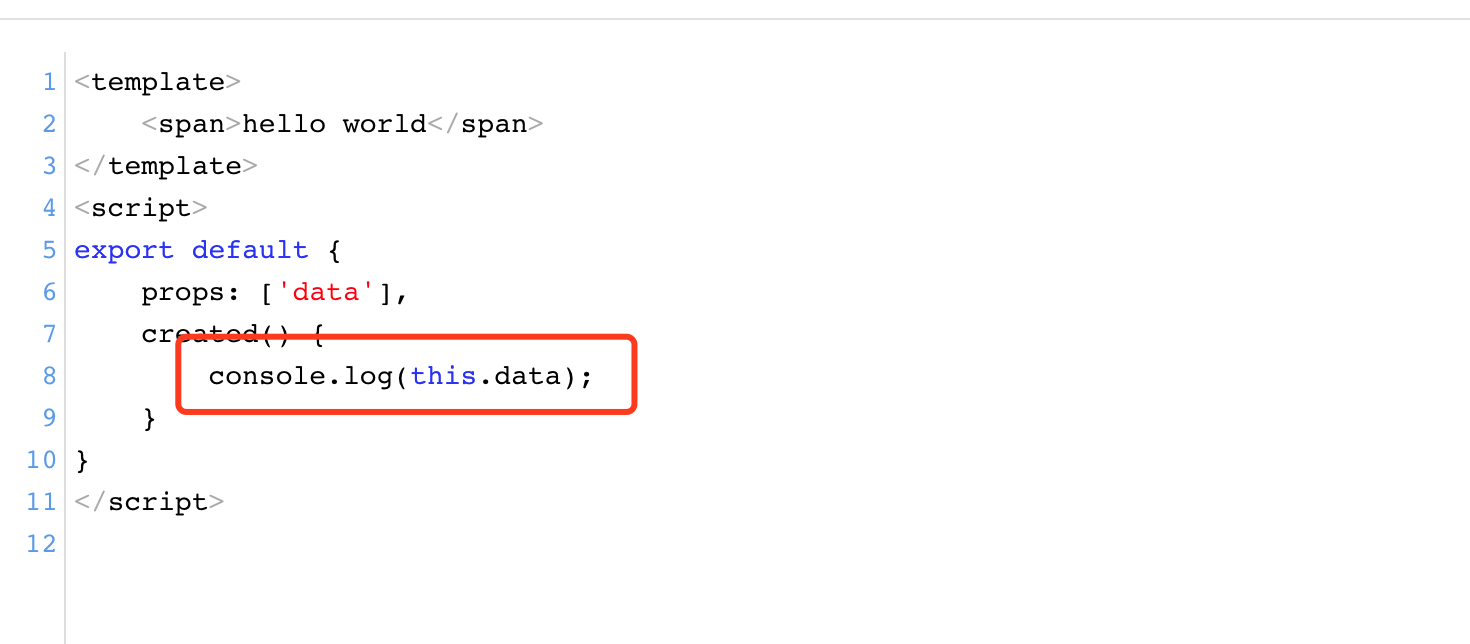
    # Using console.log to Output Key Data

    Add console.log in the Source Code

    senior-how-debug-1

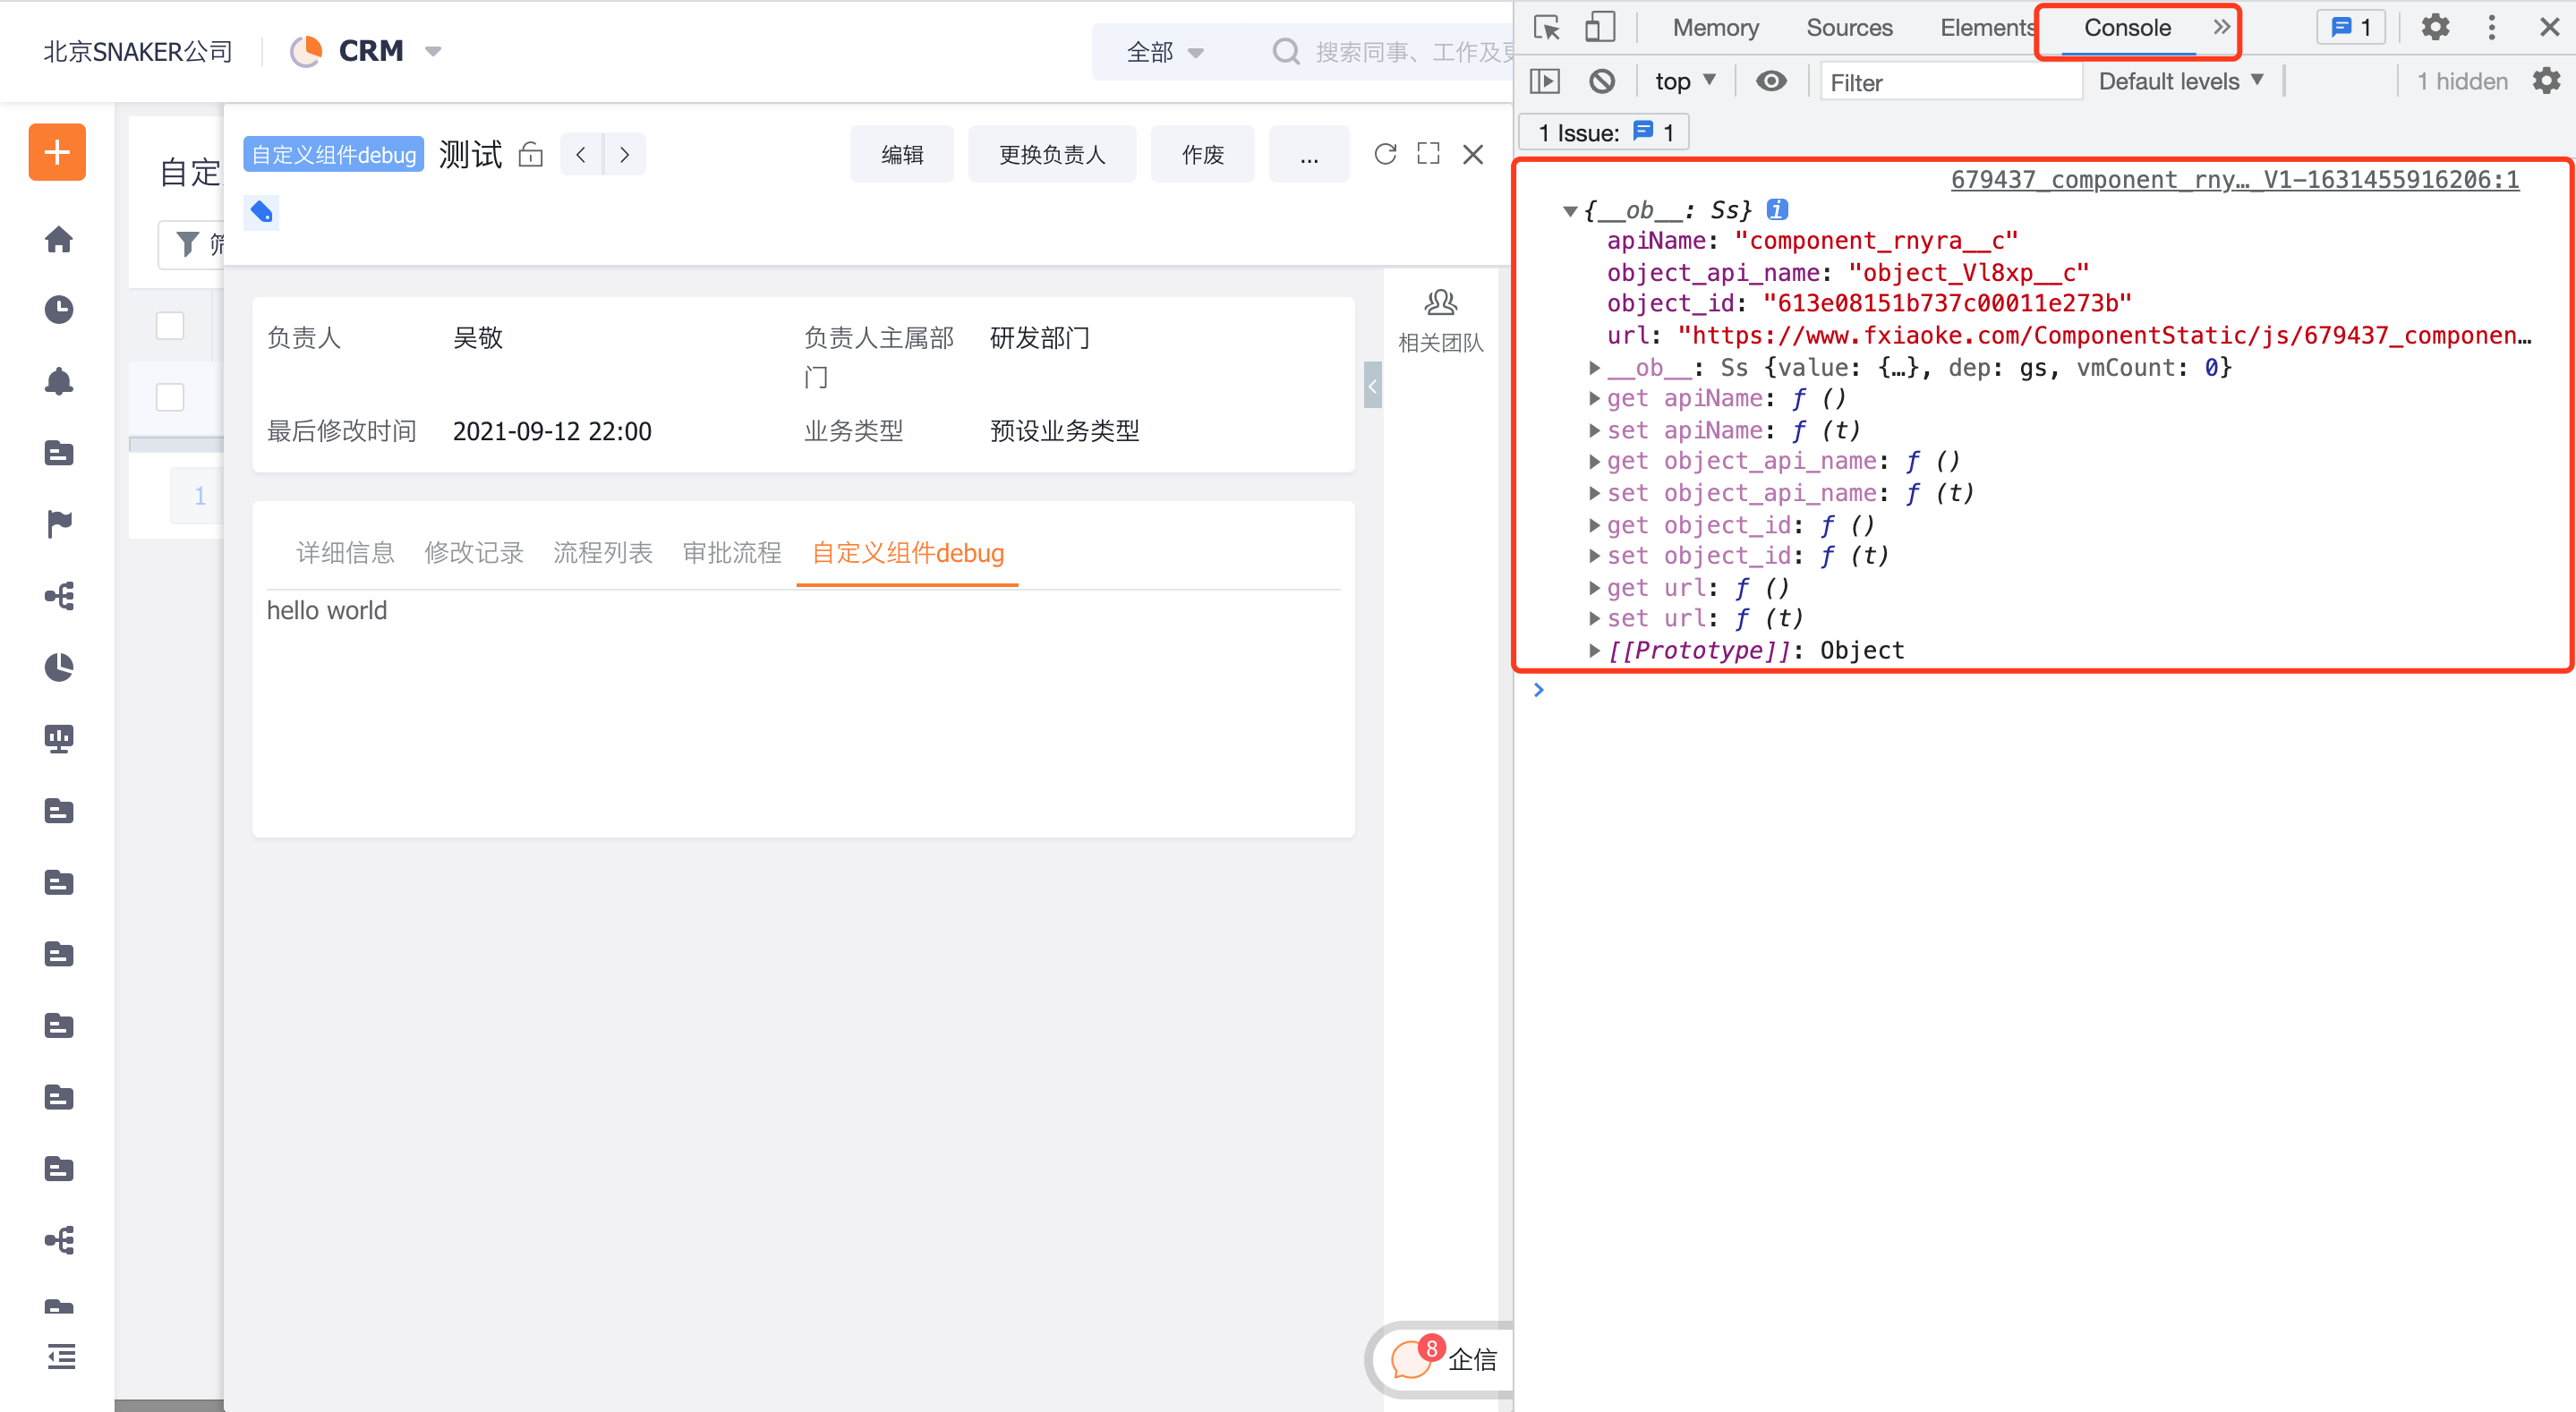
    View Data in the Console Panel

    senior-how-debug-2

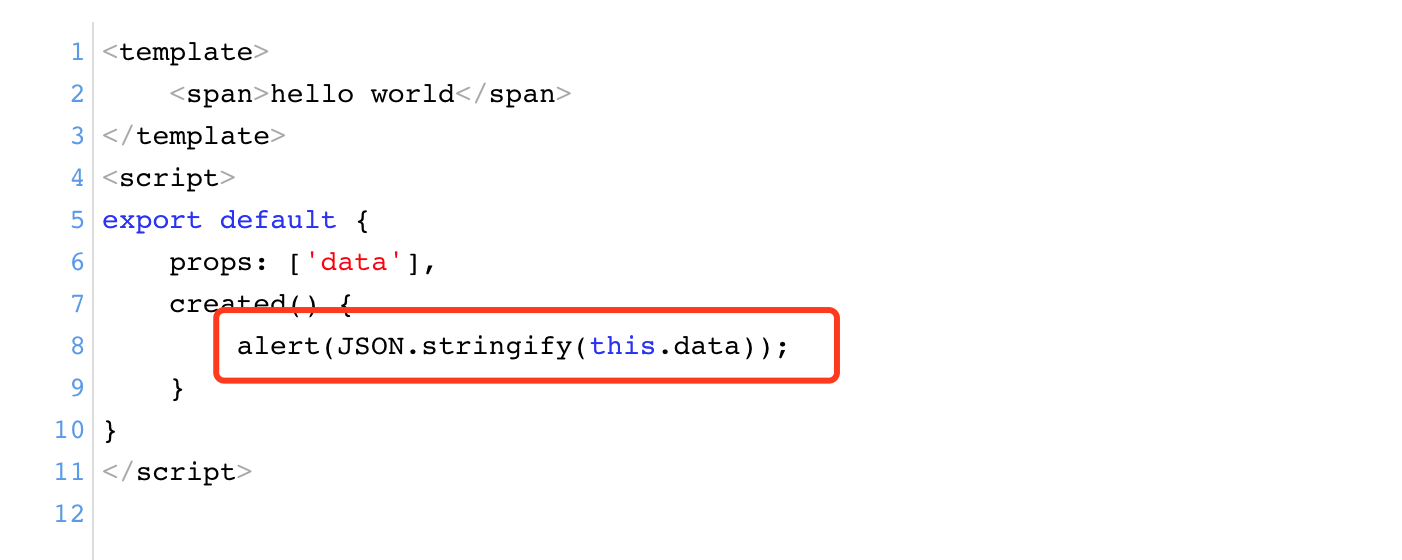
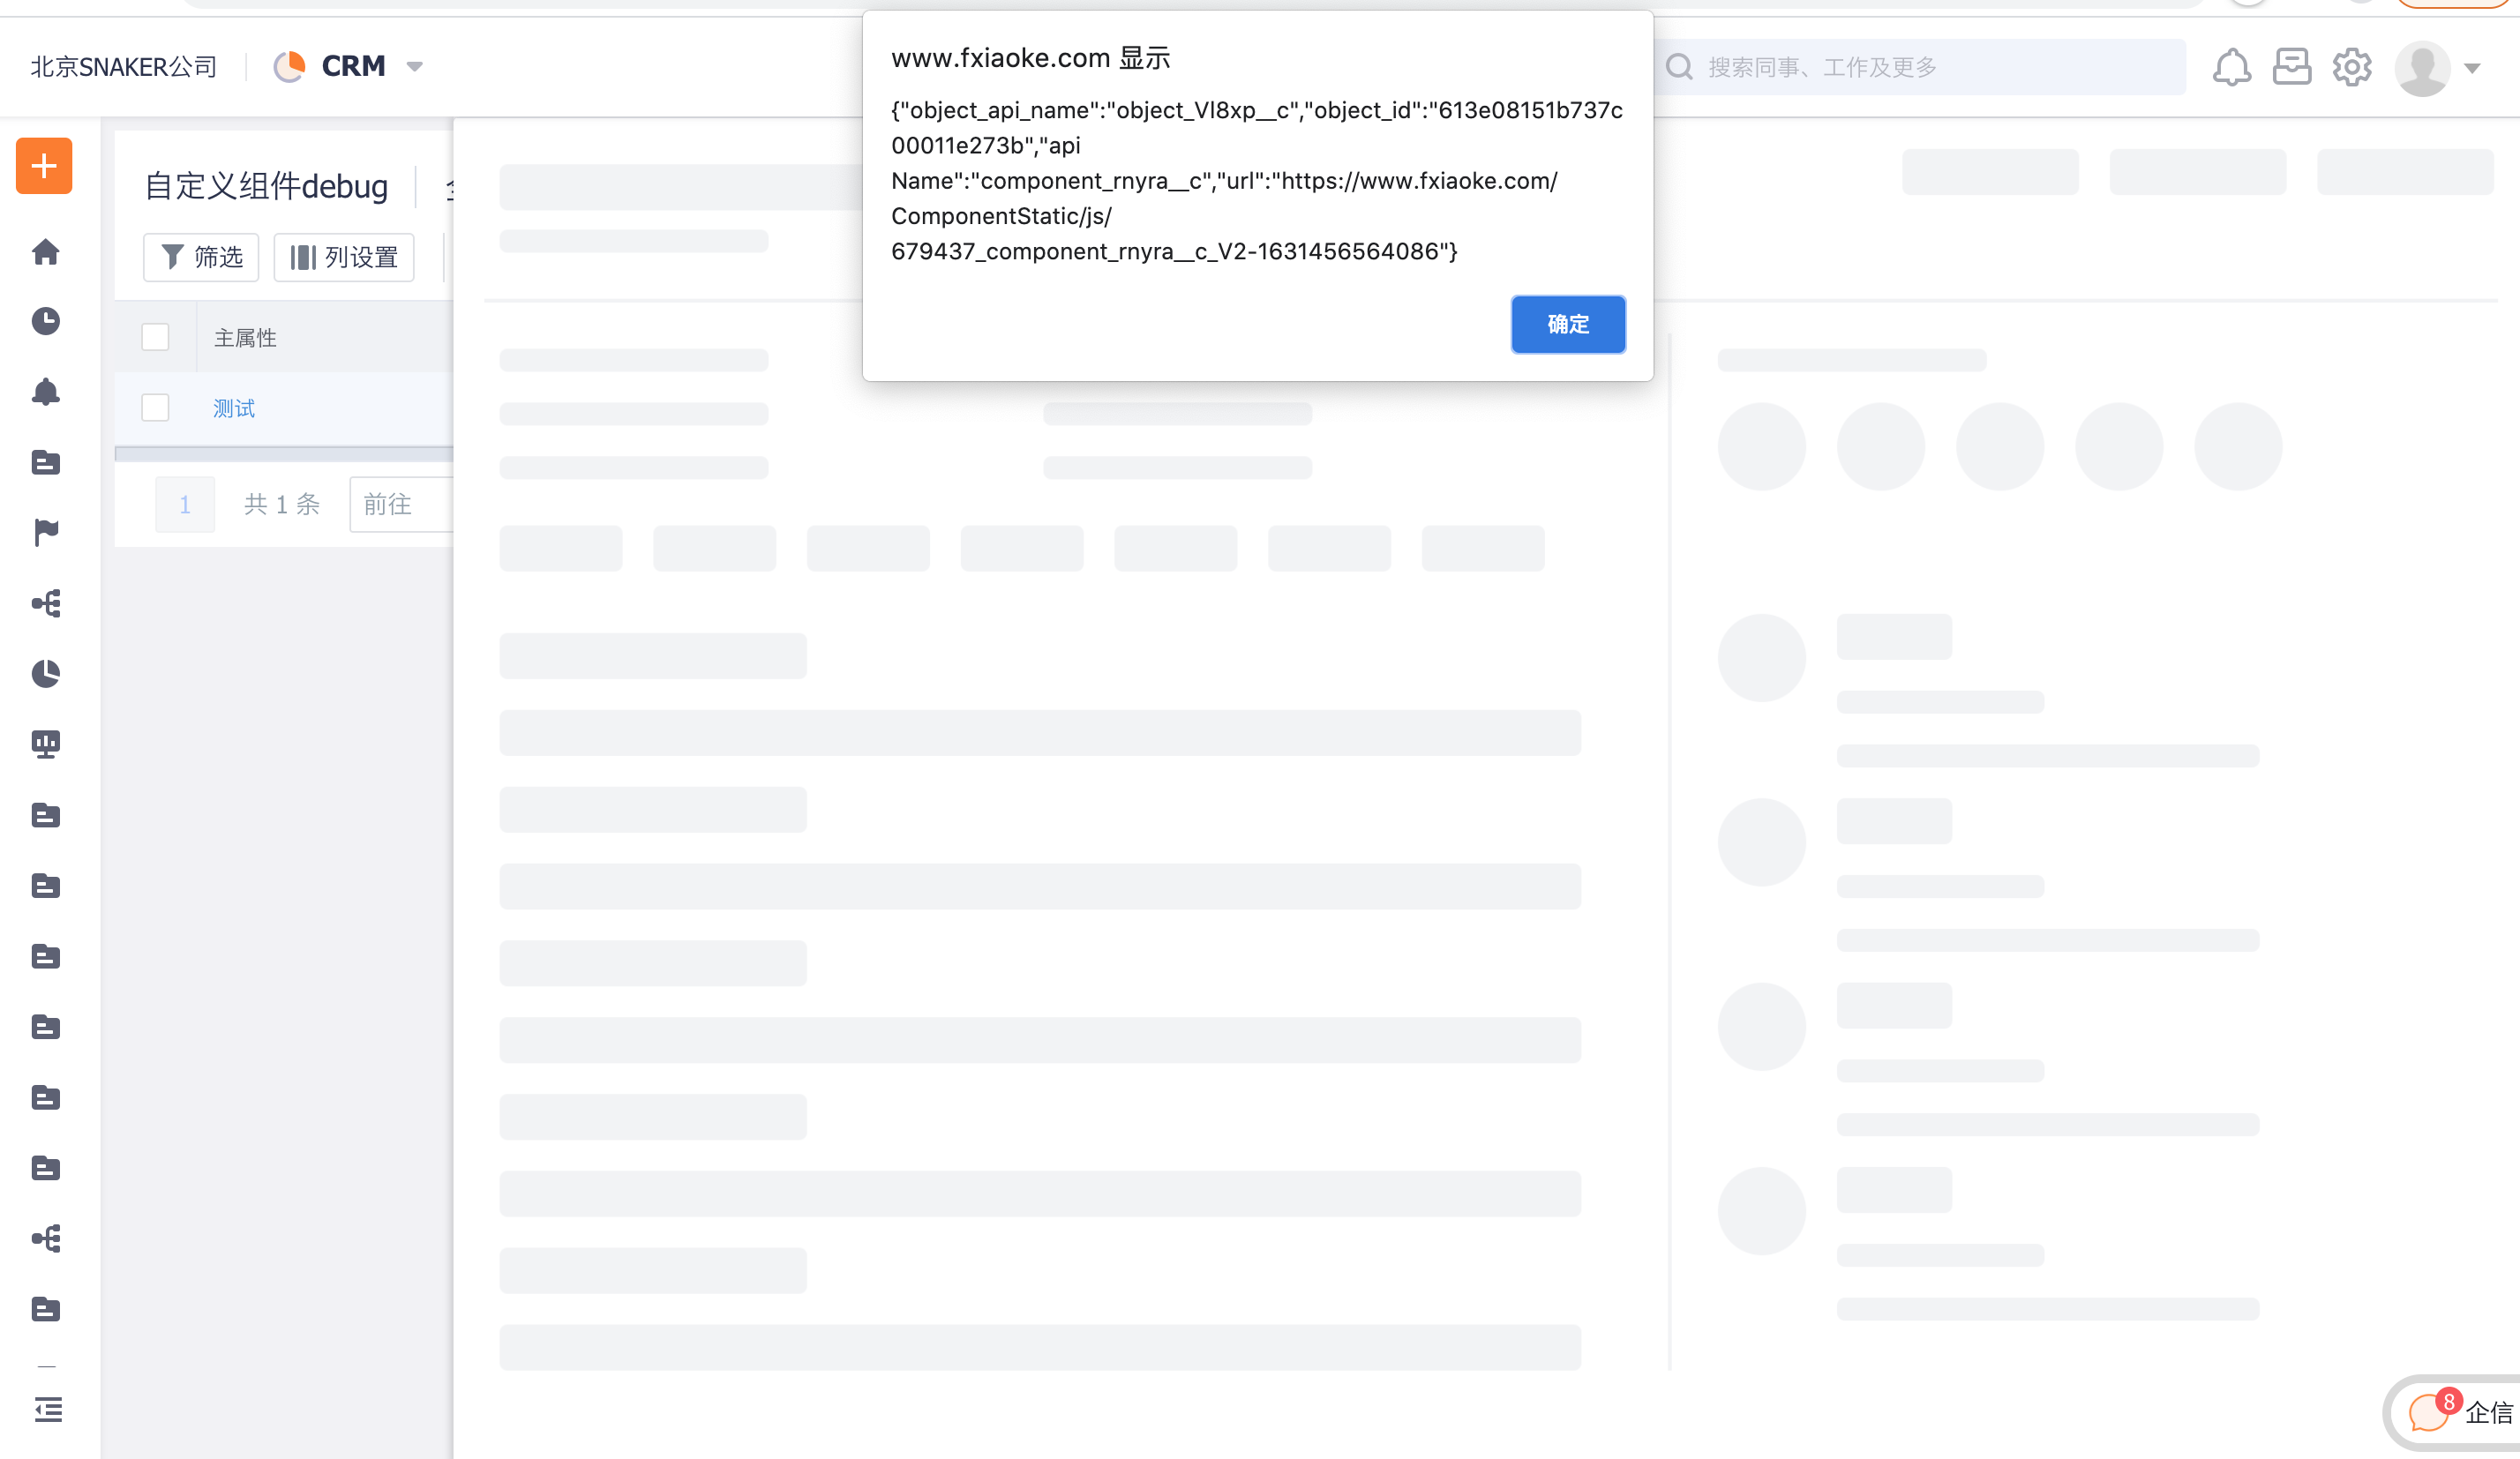
    # Using alert to Output Key Data

    Add alert in the Source Code

    senior-how-debug-3

    View Data in the View

    senior-how-debug-4

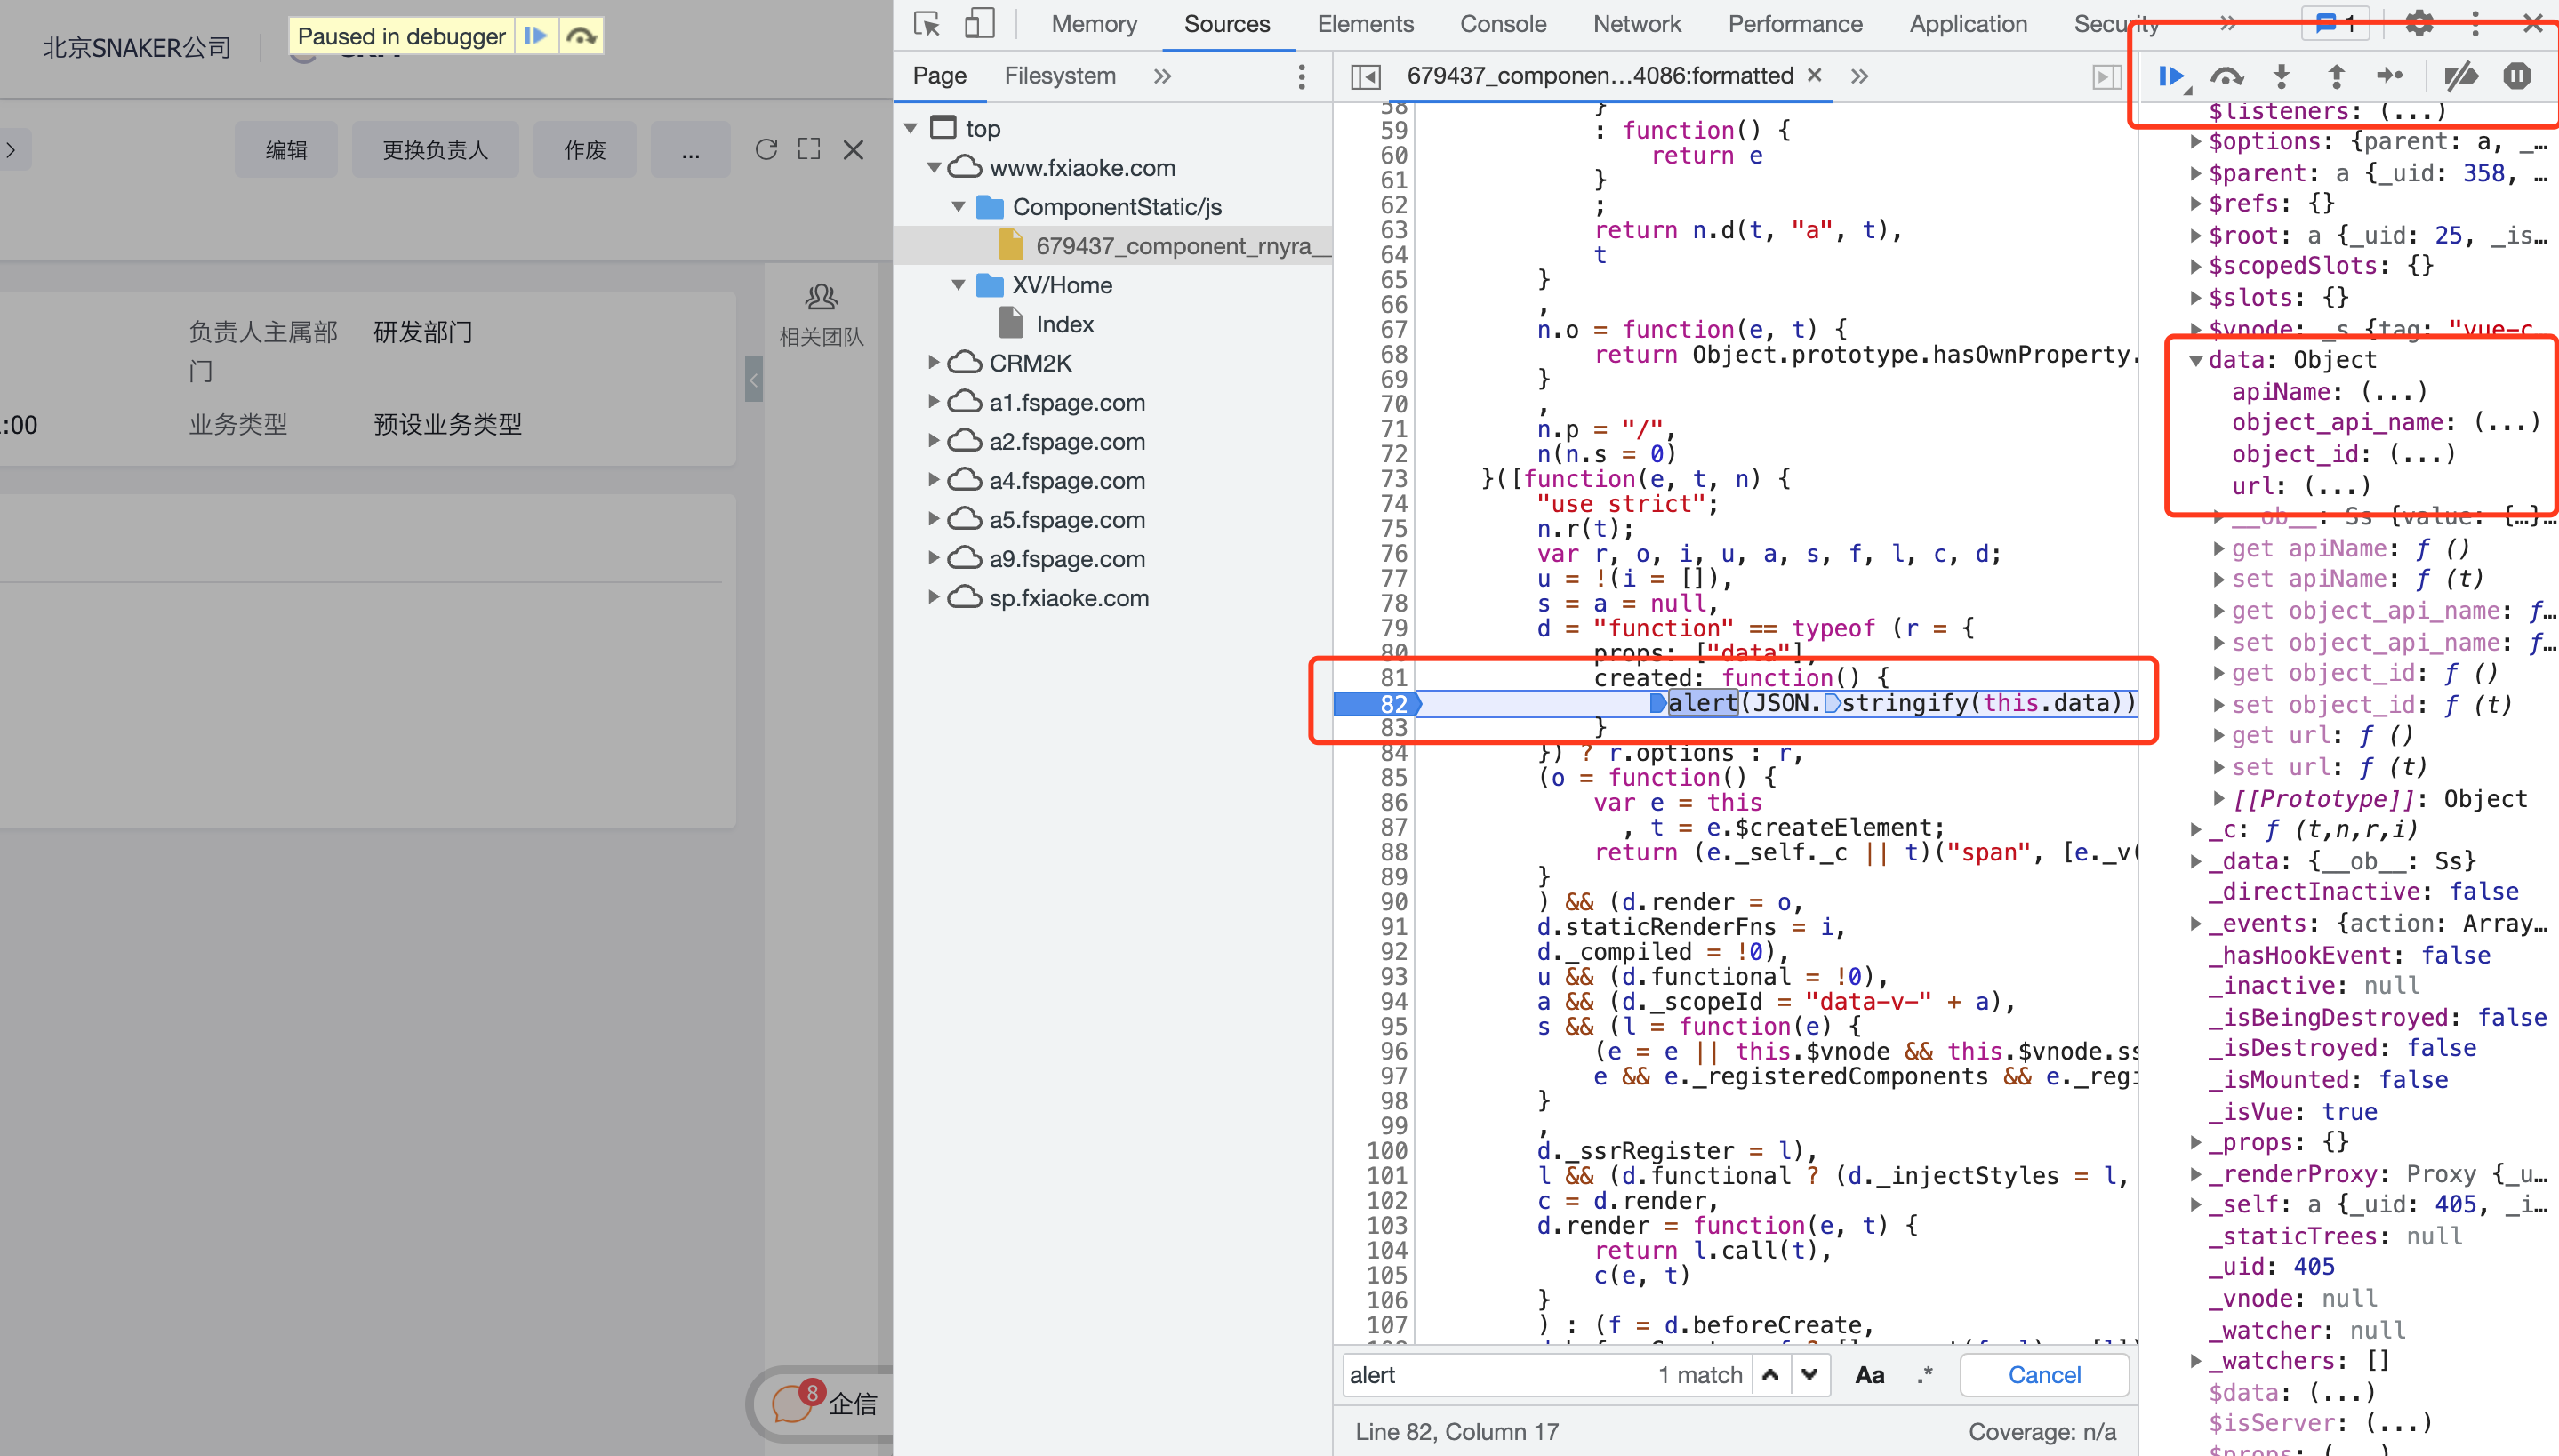
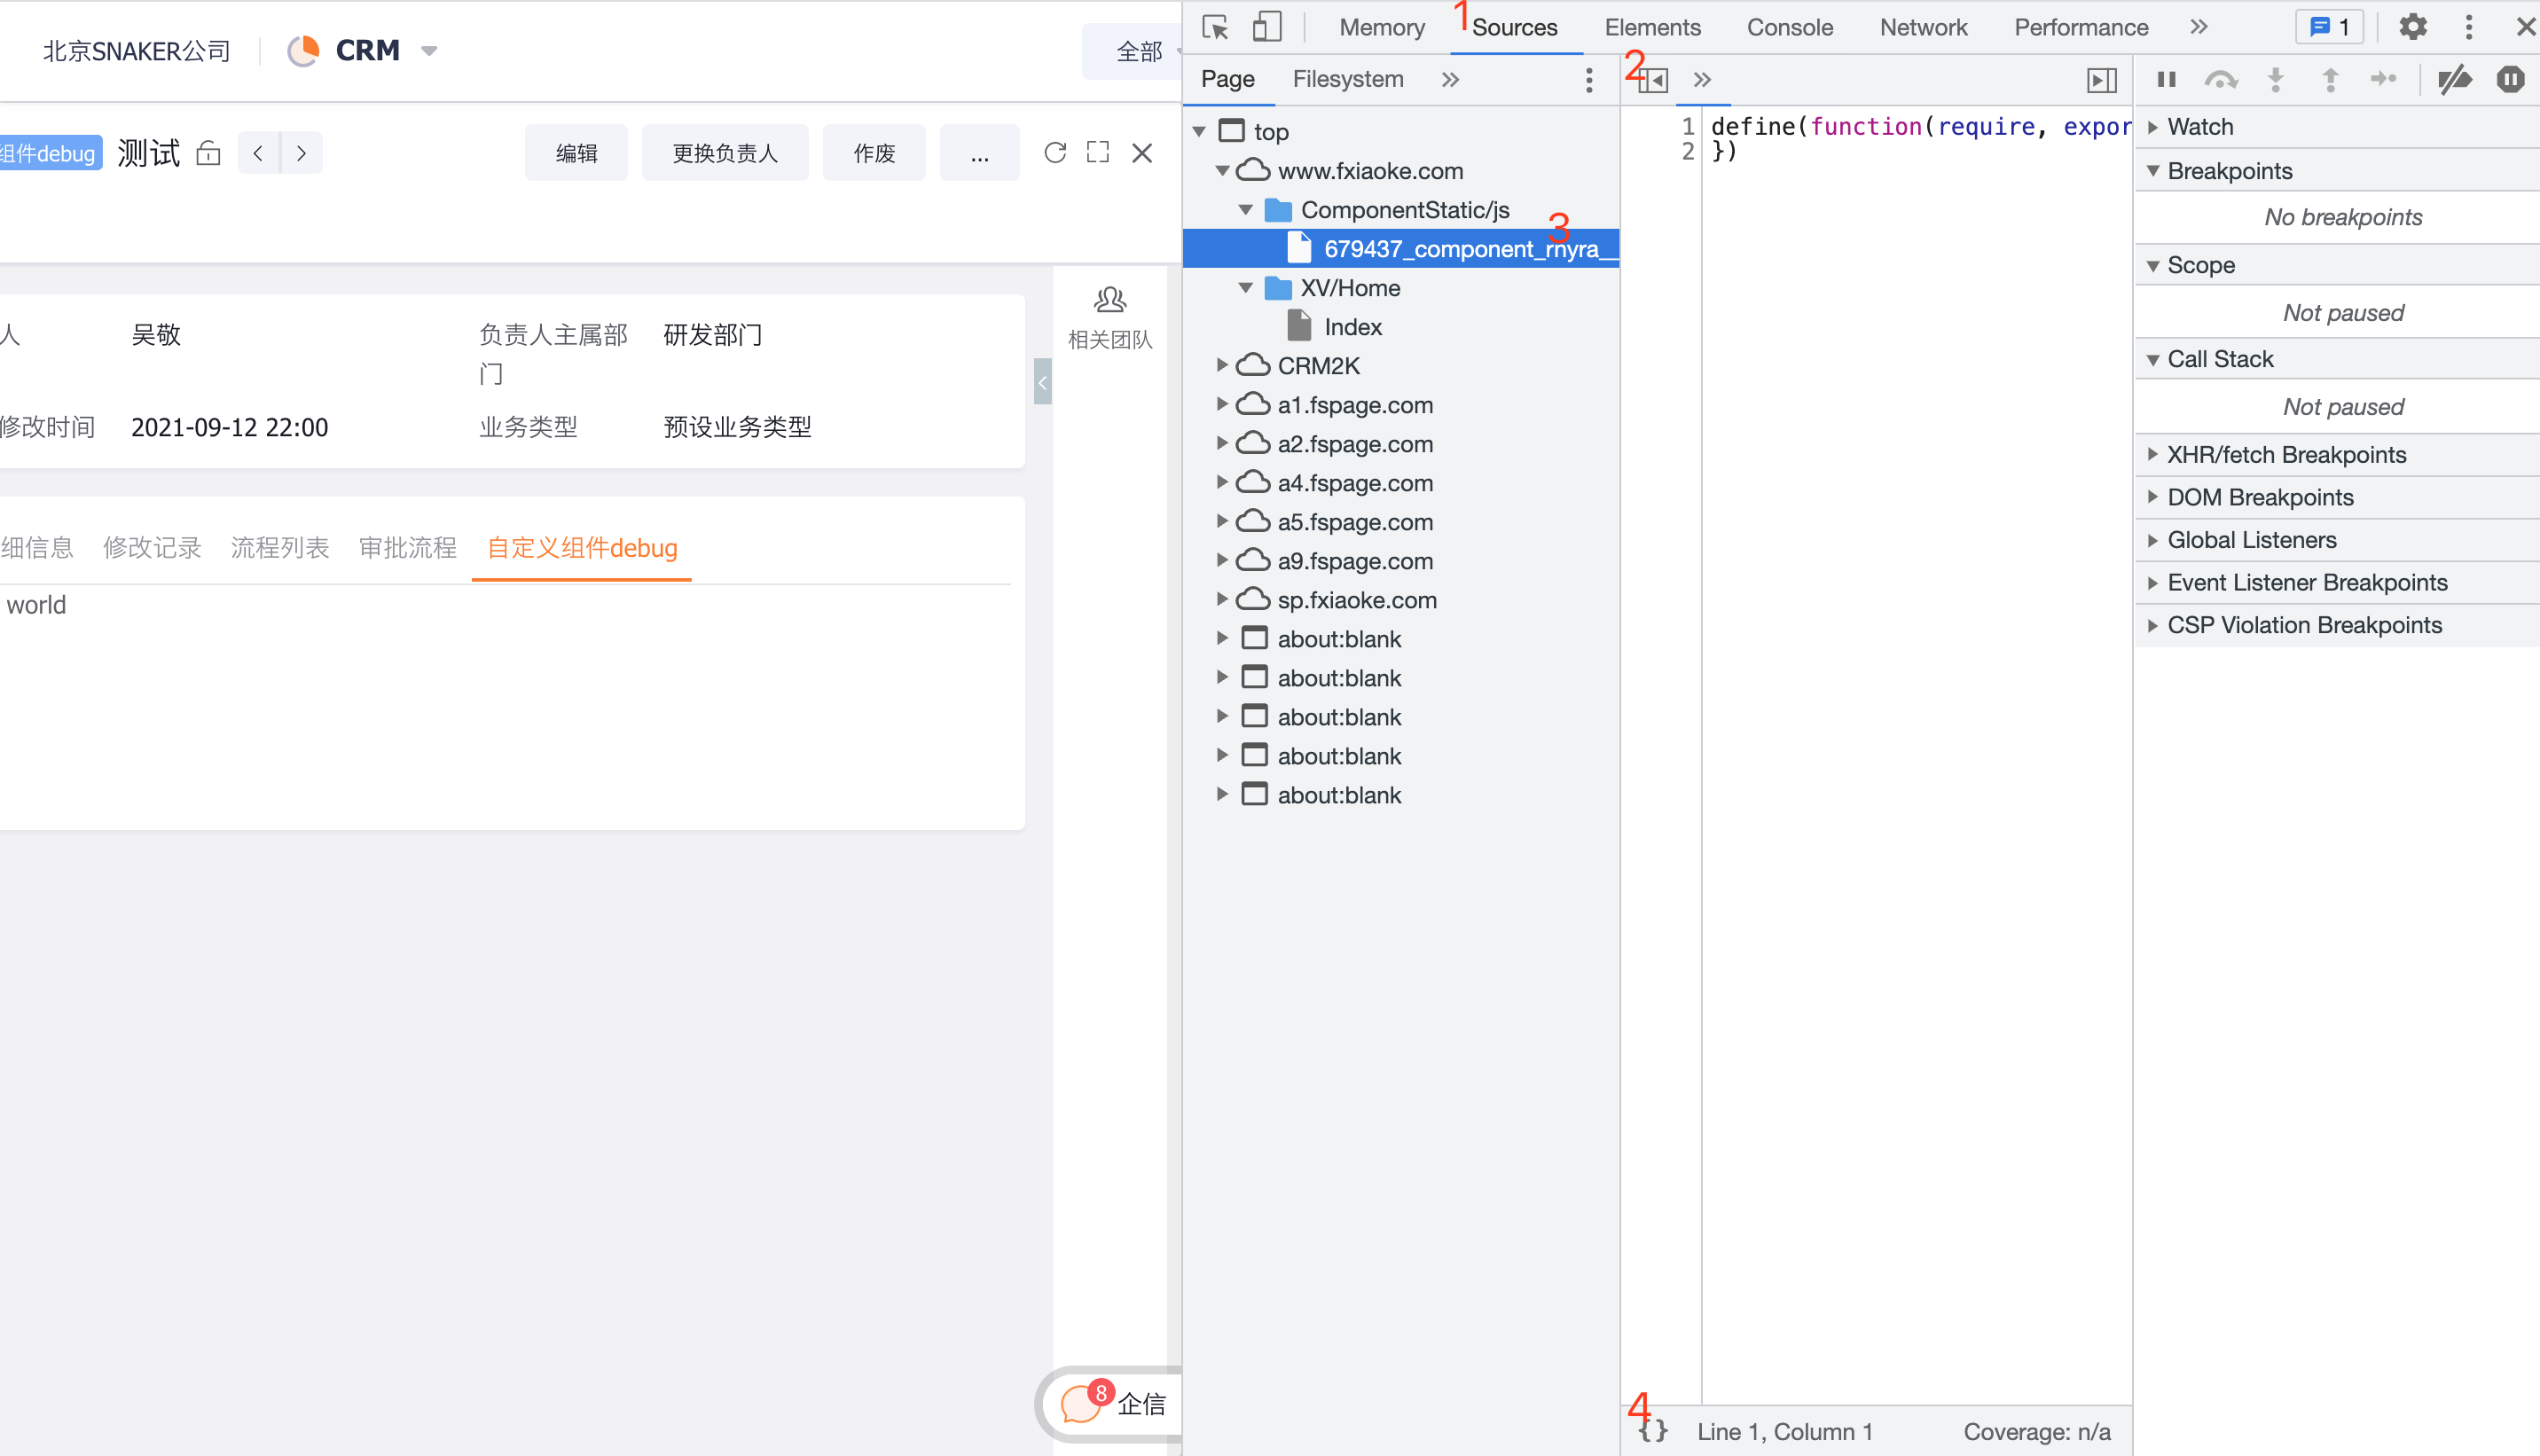
    # Debugging via Source Code

    Locate the Source Code in the Sources Panel

    senior-how-debug-5

    Set a Breakpoint by Clicking the Line Number

    senior-how-debug-6

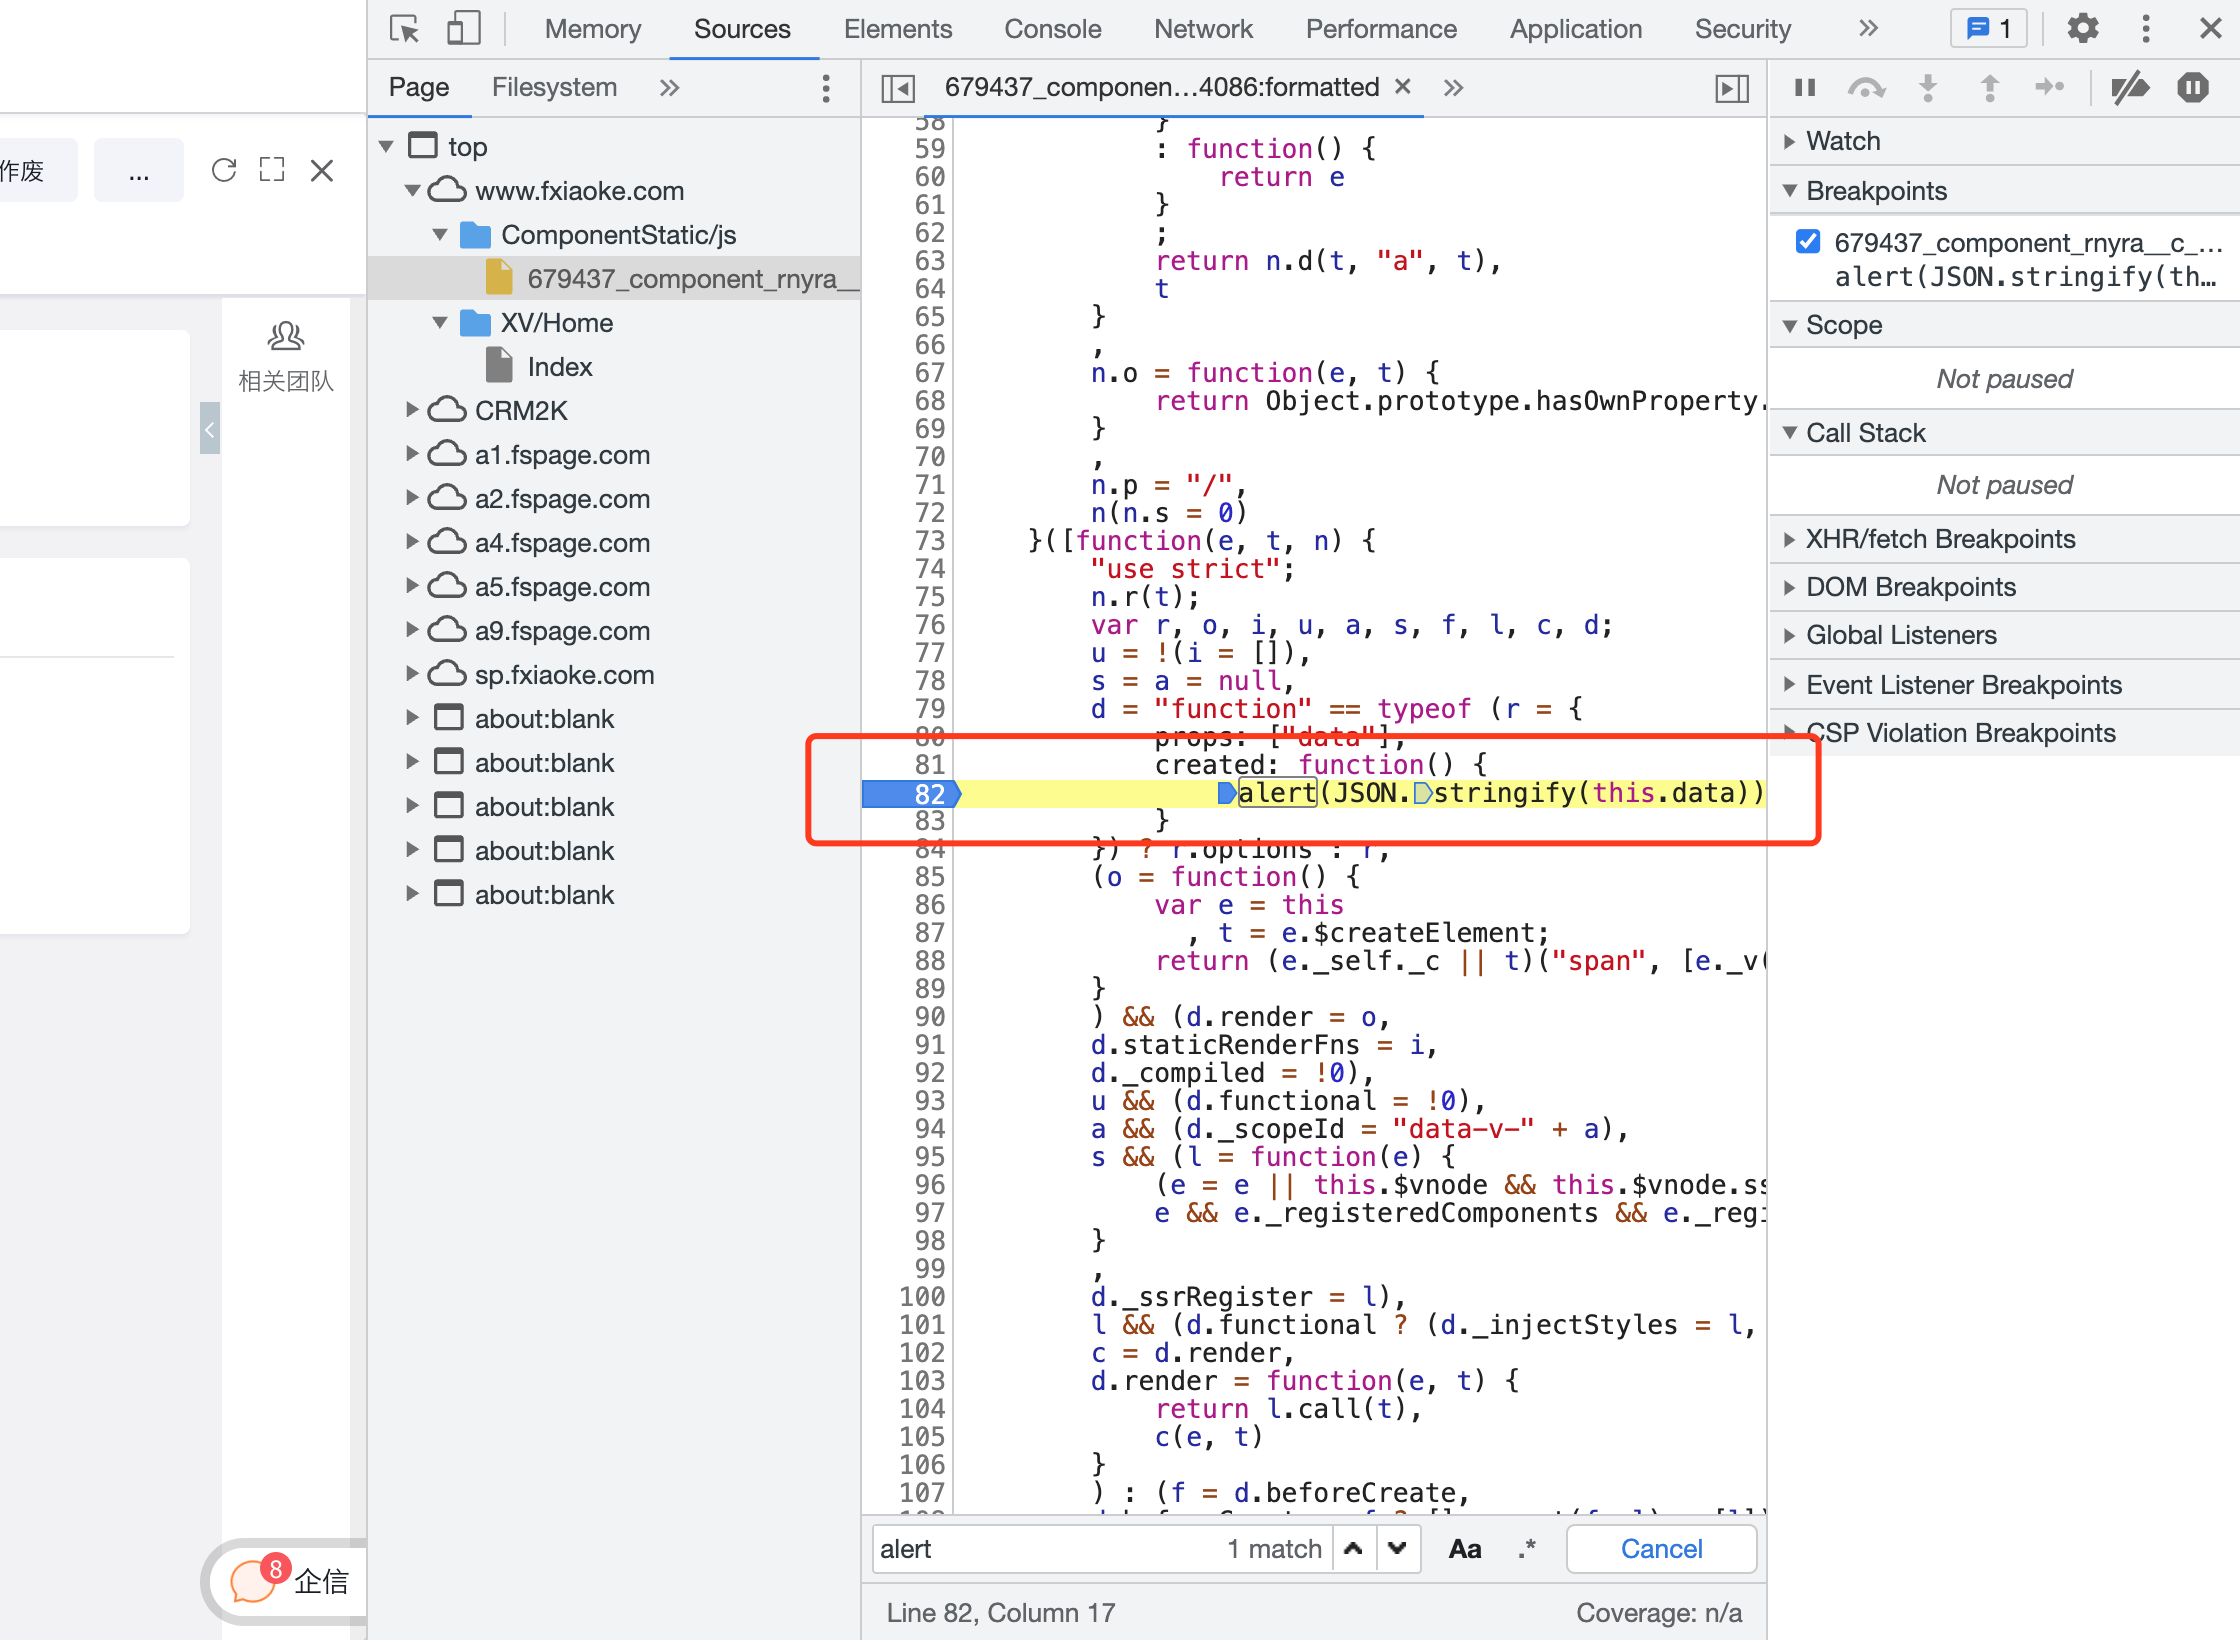
    Trigger the Breakpoint by Refreshing the Page

    senior-how-debug-7

    How to Compatible with PC and Mobile
    iframe Embedding Issues

    ← How to Compatible with PC and Mobile iframe Embedding Issues→

    • 跟随系统
    • 浅色模式
    • 深色模式
    • 阅读模式